Fourth and Why
Predicts each NFL team's win probability and explains which factors drove each pick.
65.5% winner accuracy, against 53.7% for always picking the home team. Held-out 2019–2025 seasons, 1,954 games; Vegas favourites: 66.4%.
- Role
- Solo project for Michigan Edge, the University of Michigan sports analytics club: data pipeline, features, model, dashboard and the weekly automation.
- Stack
- Python, pandas, scikit-learn, Streamlit
- Year
- 2026, featured project
The demo's server sleeps when idle, so its first load can take up to 30 seconds.
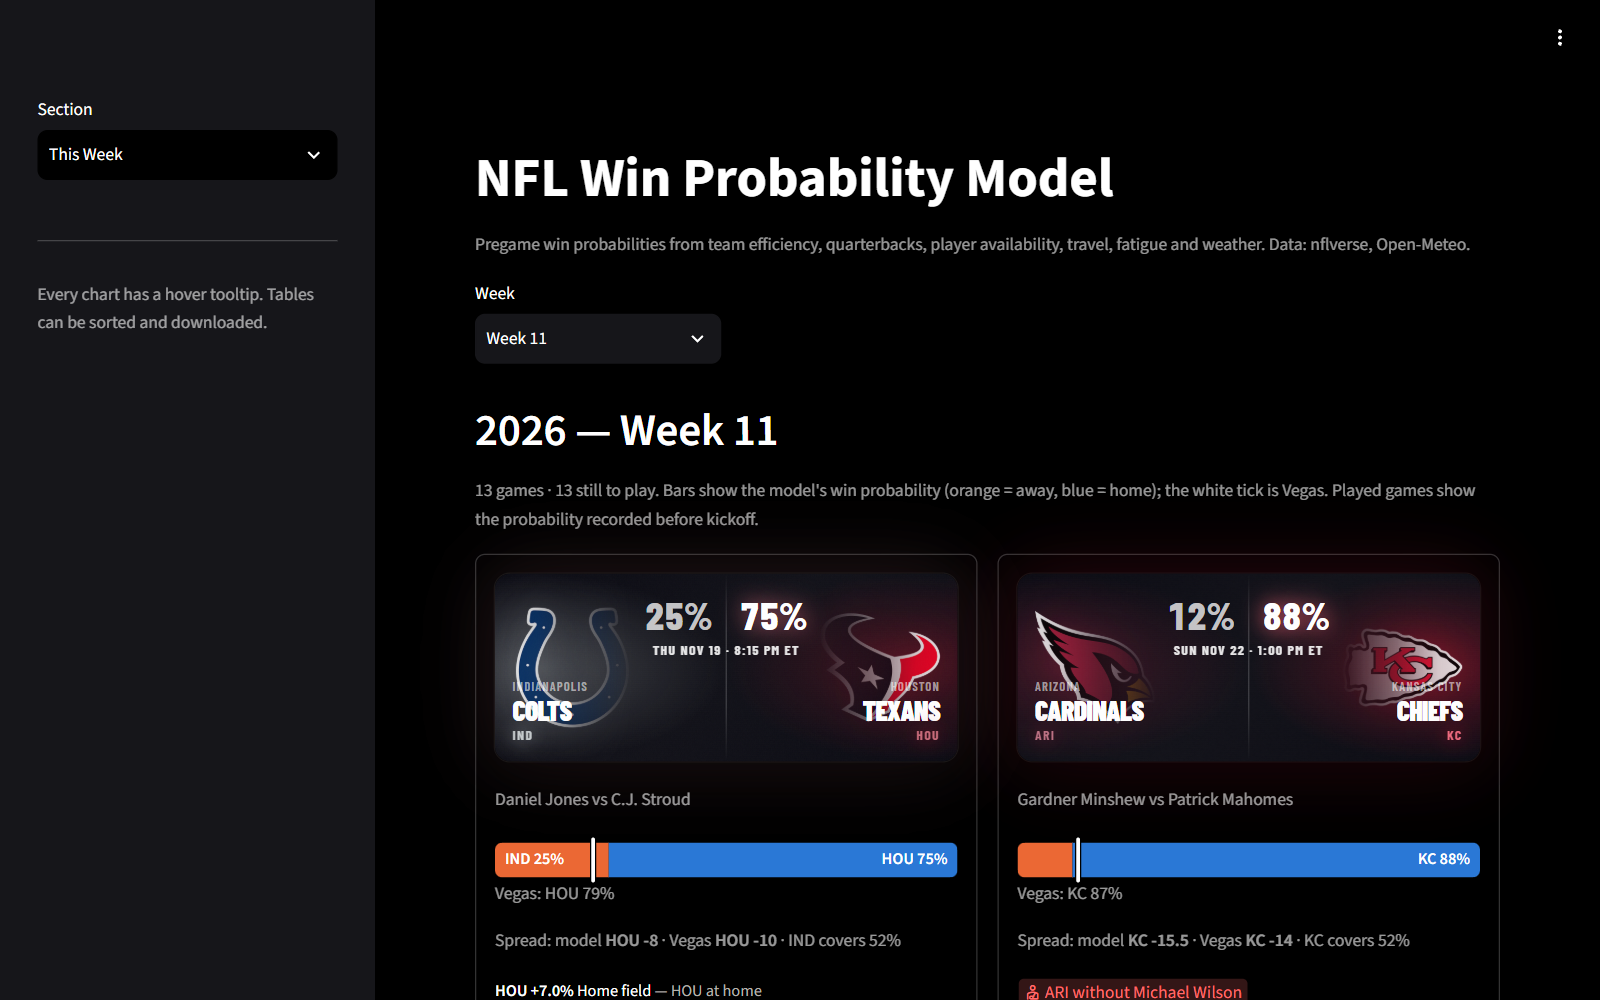
The live dashboard shows each week's games with both teams' win probabilities, the Vegas line for comparison, a predicted spread and the top reasons behind each pick. It runs Streamlit in the browser on GitHub Pages and updates itself three times a week.
Key features and results
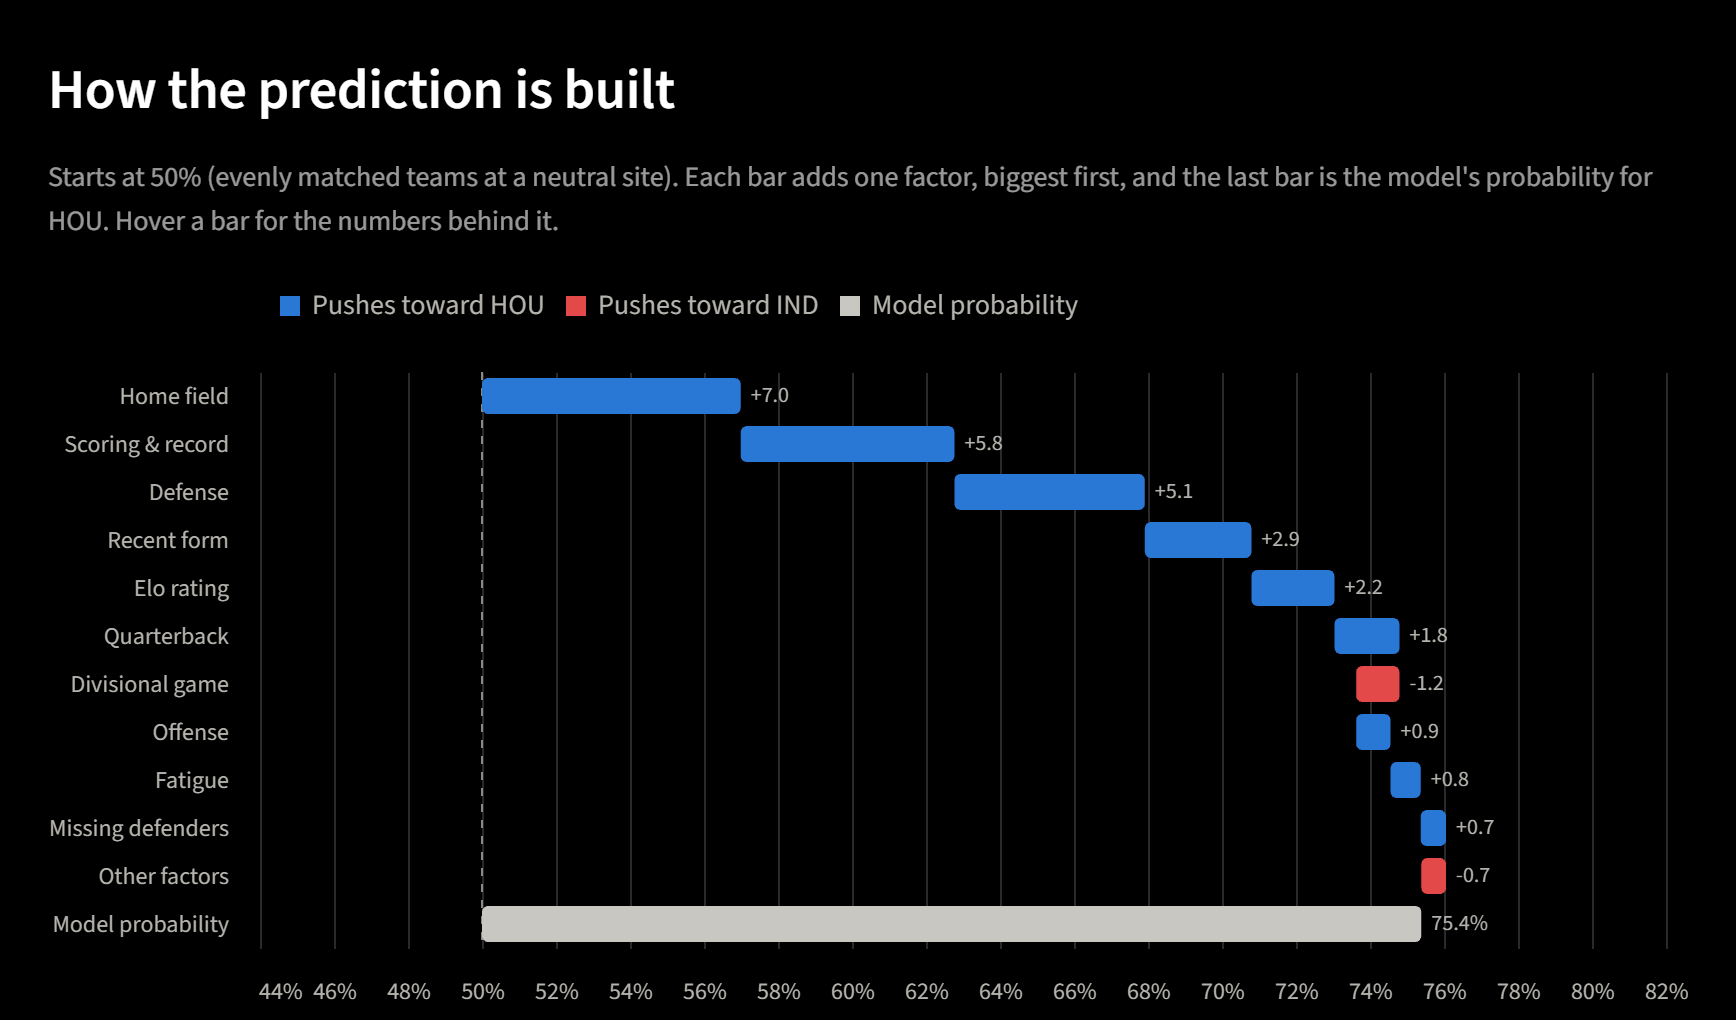
Every pick breaks down exactly. The model adds up weighted home-minus-away differences, so a waterfall can start at 50% for two evenly matched teams on neutral ground and add one factor at a time until it reaches the model's probability. Related features are grouped (quarterback, defense, home field, fatigue) and the steps sum exactly, which a test checks. A what-if option shows how much a backup quarterback would change a game.
Architecture
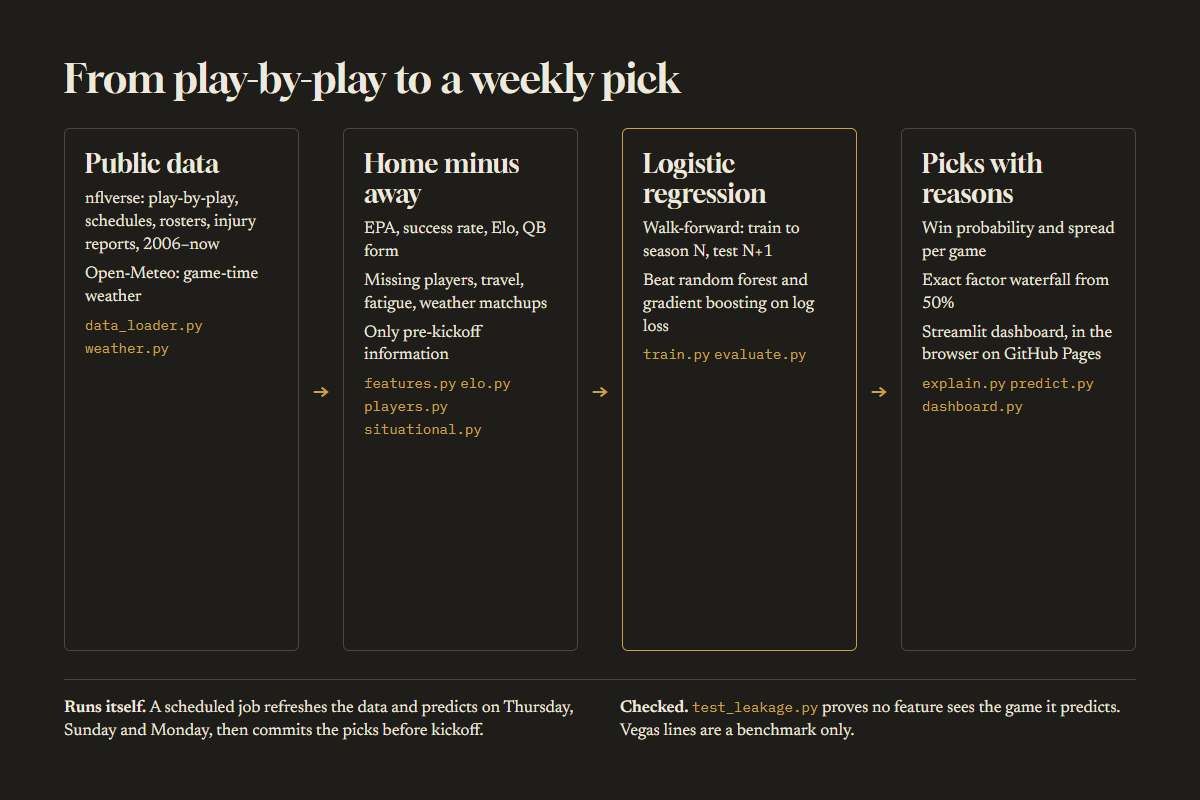
Each game is one row from the home team's side, and every feature is a home-minus-away difference built only from information available before kickoff; a test proves no feature sees the game it predicts. Models are judged walk-forward: train through one season, test on the next. Logistic regression beat random forest and gradient boosting on log loss and is the easiest to explain, so it is the final model. Vegas lines are a benchmark only, never an input. A scheduled job refreshes the data on Thursday, Sunday and Monday and commits each prediction before kickoff, so the record is timestamped.
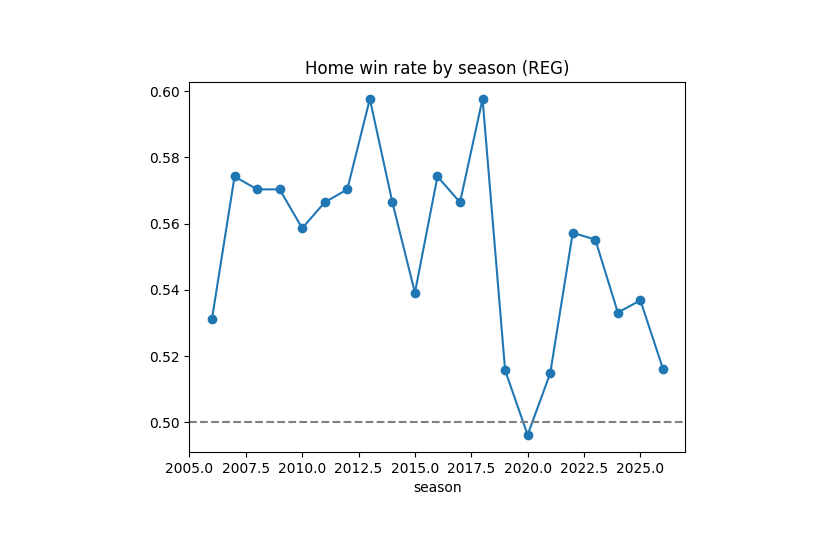
Origins
It started on 21 September 2026 with a data loader and an exploration notebook. The notebook's first chart asked the simplest question: how often does the home team win? In most seasons since 2006 the answer was between 53% and 60%, and lower since 2019. The next commits added team stats, Elo and leakage tests, then the logistic regression, and then the dashboard and its factor explanations.